Predicting Spotify Track Skips
Working on the Spotify Sequential Skip Prediction Challenge
Introduction
I worked on a slightly simplified version of the Spotify Sequential Skip Prediction Challenge [1] as my 3rd project for the Metis Data Science Bootcamp.
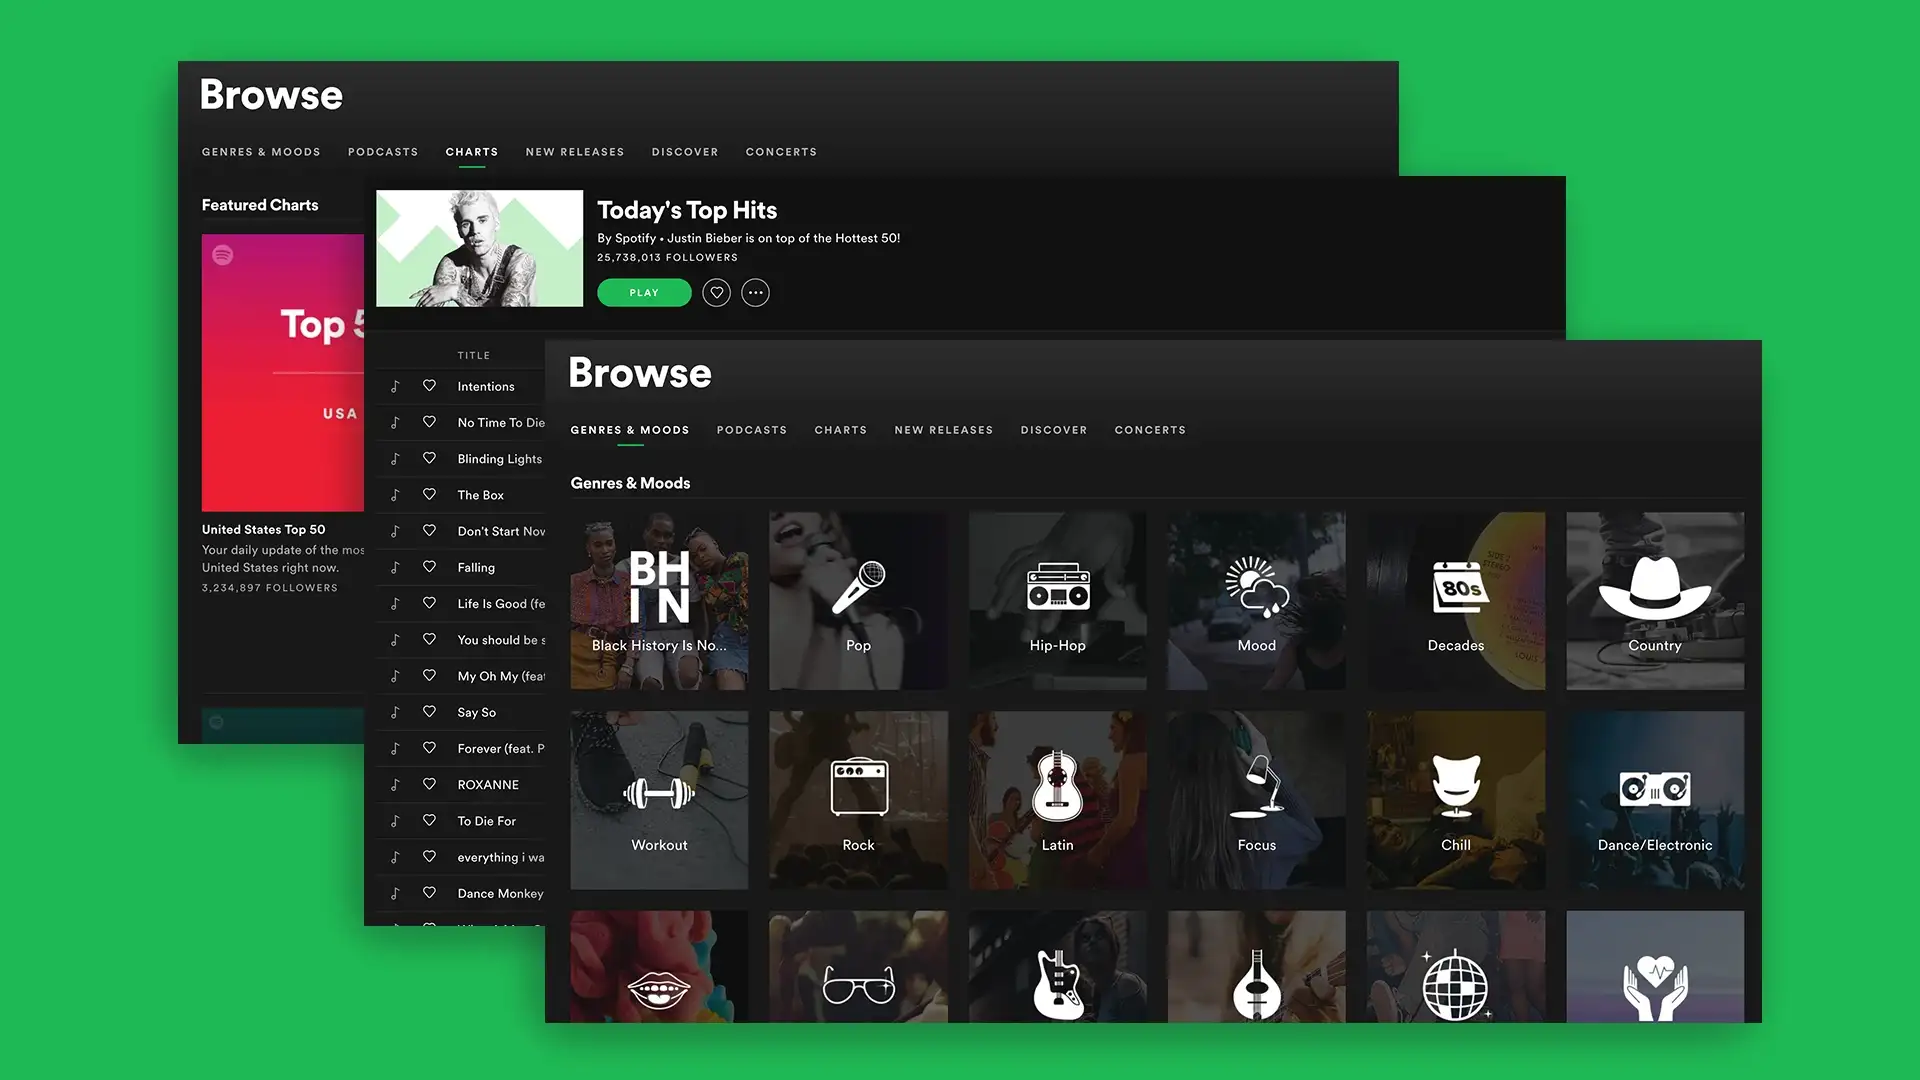
Spotify — as I'm sure you're aware — is a streaming service whose business model is centered around delivering song recommendations to users in order to keep them using their app.
Spotify has over 190 million active users interacting with over 40 million tracks.
The goal of the challenge is to predict the likelihood of a user skipping any given song during a listening session.
Methodology
The Data
For the competition, Spotify supplied two main sets of information. One table has information about user listening sessions. For example:
- Session ID
- Position in the session
- Track ID
- If the track was skipped or not
- Other session metadata
Note that the user sessions were all between 10 and 20 tracks long and didn't include any identifiable information about the users.
The second table has metadata about the tracks (corresponding to the track_id feature from the session table), such as:
- Track duration
- Track popularity in the US
- Release year
As well as some extra features, generated by Spotify, to describe the songs, such as:
acousticnessbeat strengthbouncinessdanceability
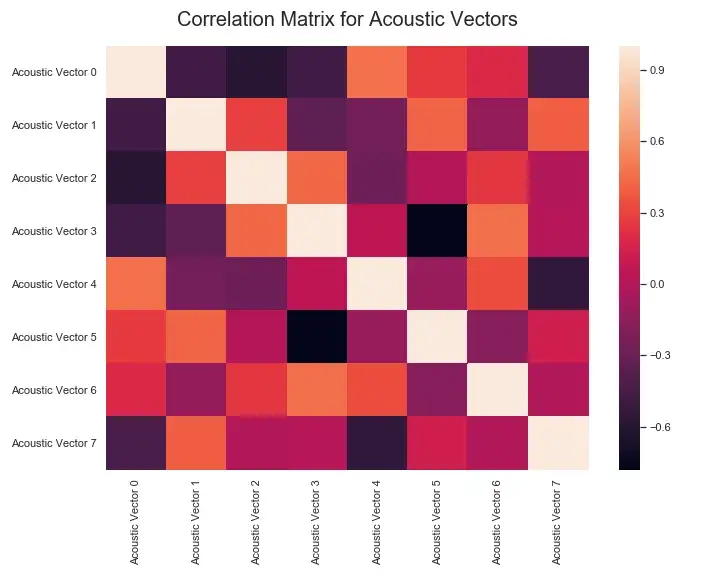
The dataset also includes a set of 8 “acoustic vectors” for each track which are latent encodings that Spotify has generated for each track.
For licensing reasons, Spotify anonymize the track information, so there aren't any data on things like track name, artist, album, or genre.
The targets in the provided dataset — whether or not the track was skipped — are balanced with about 51.7% of the tracks being skipped. So there was no need to adjust the class balances for training.
There was a surplus of data so I worked with a subset of about 100k rows from the session table and the corresponding rows from the track table, which I loaded into a Postgres database hosted on an AWS EC2 instance. The database schema is shown below:
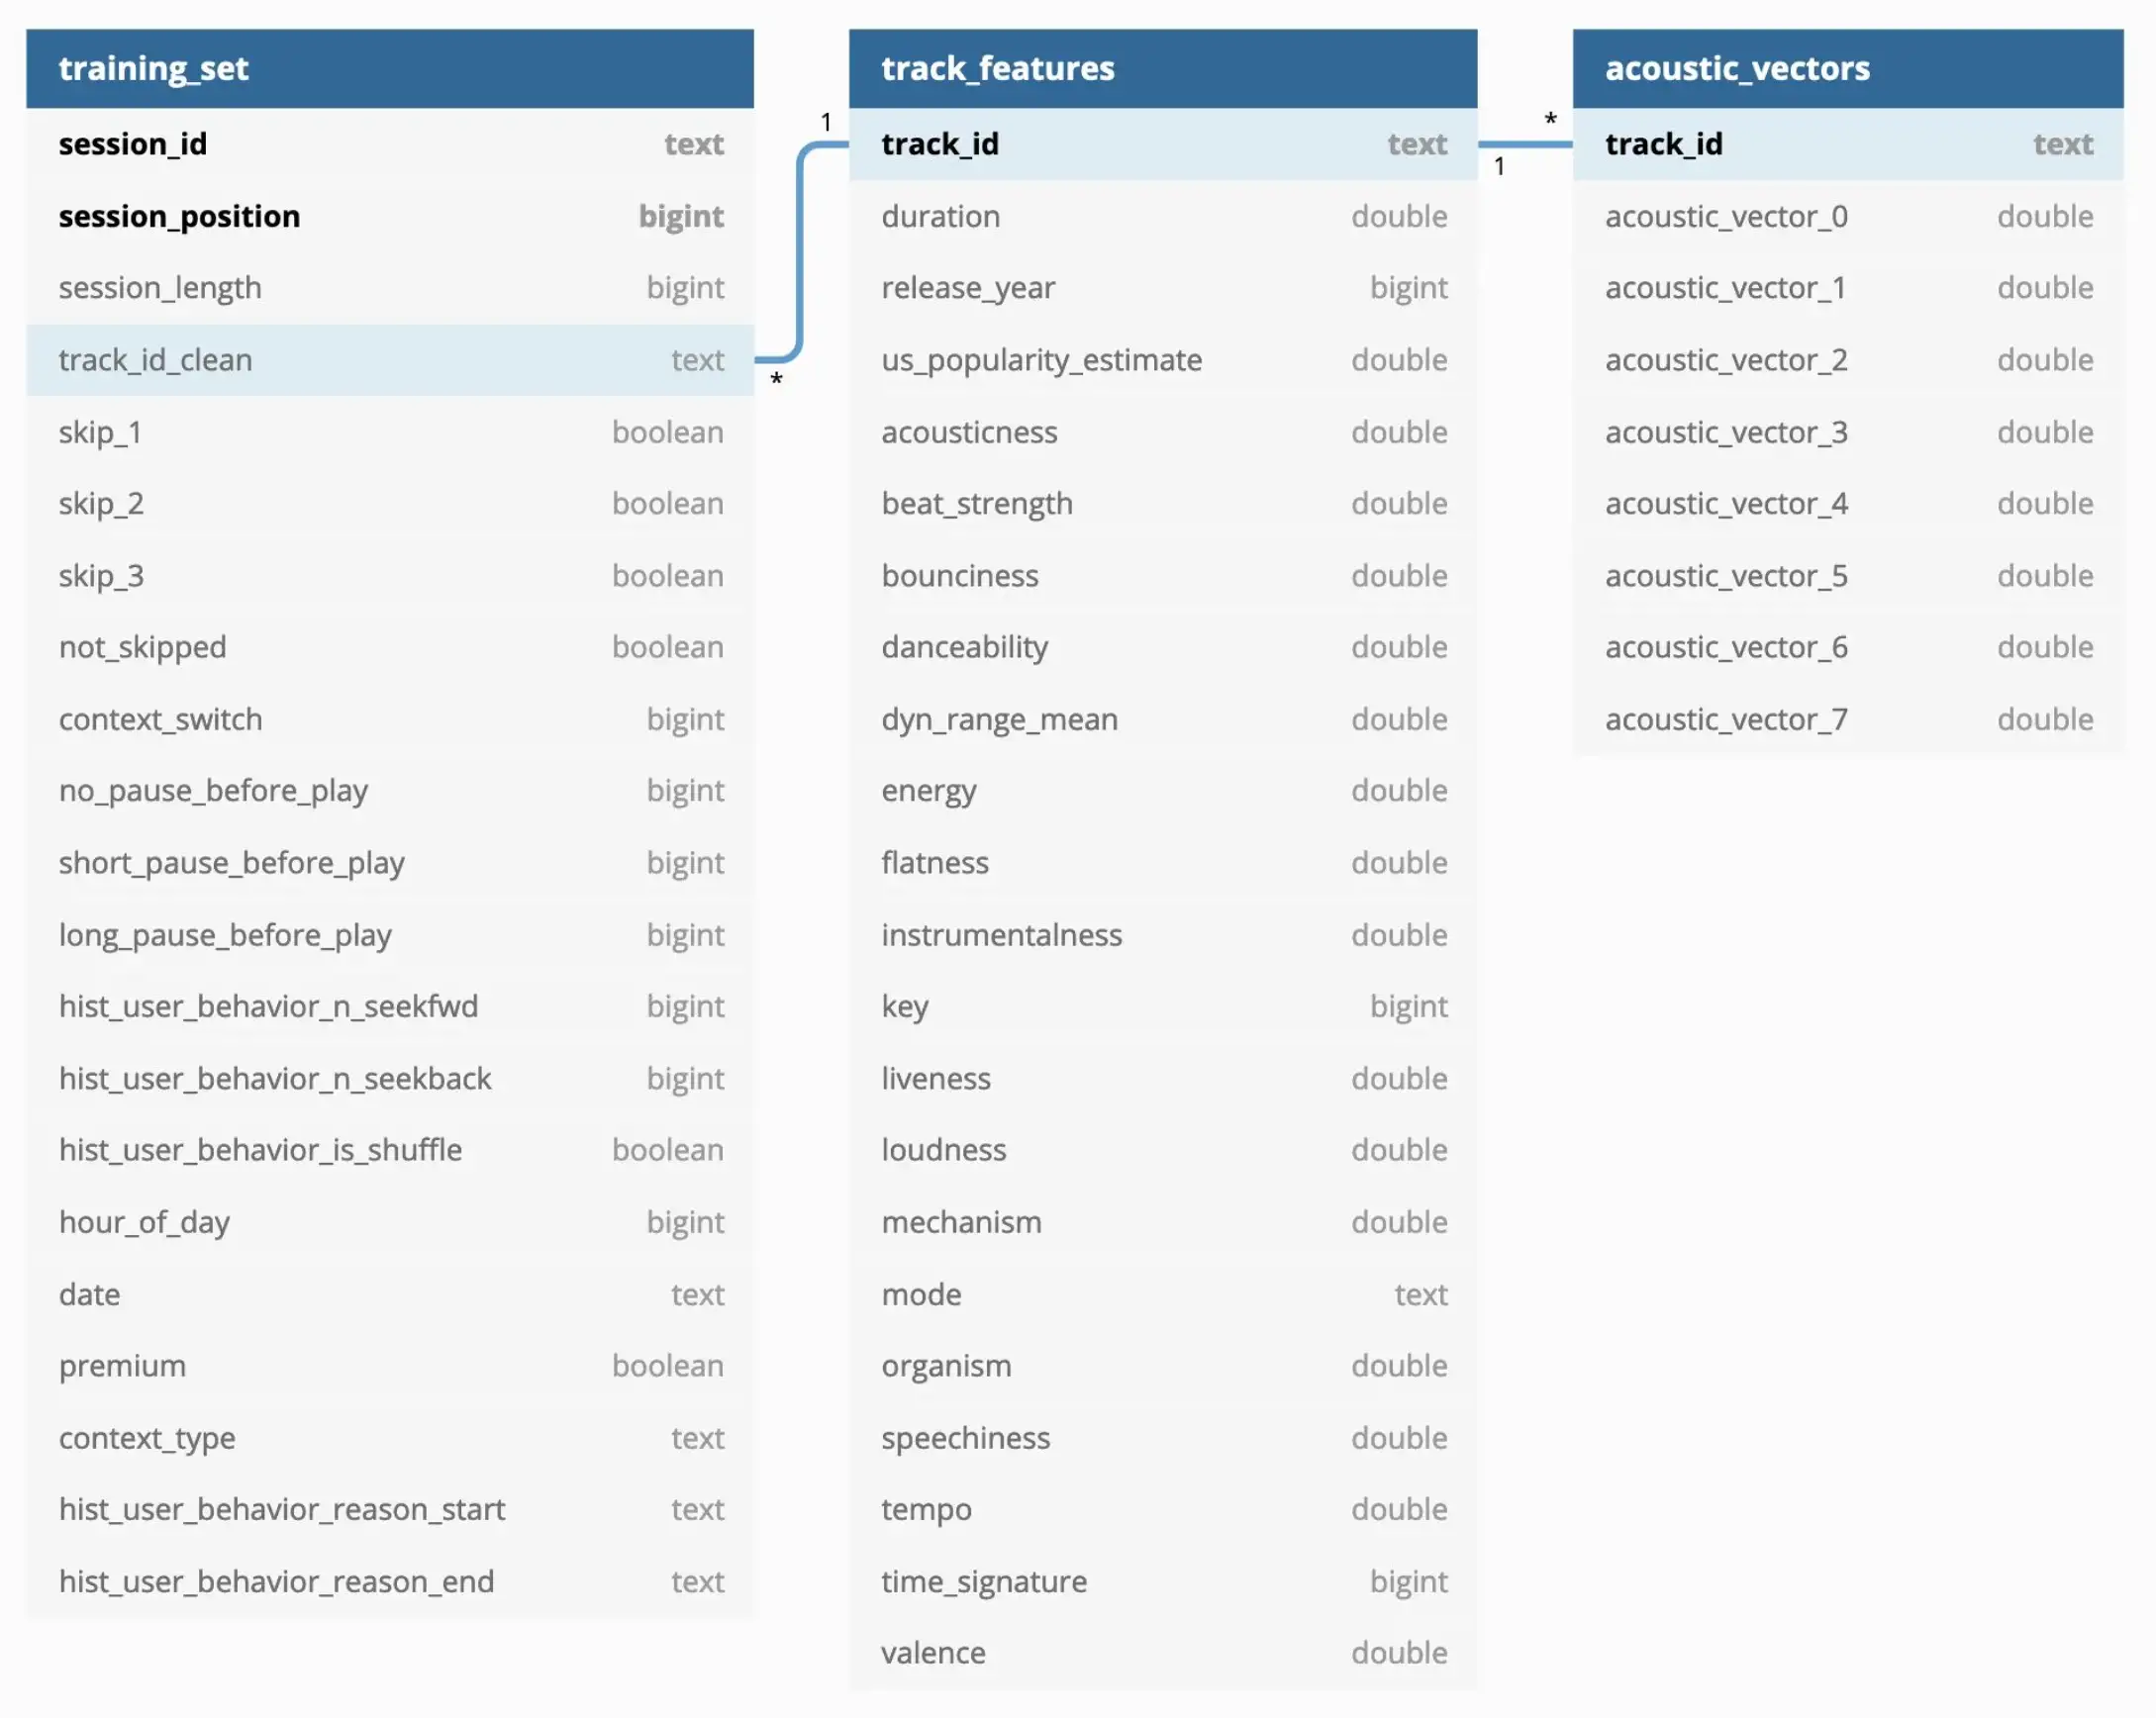 Schema for Spotify Skip Data
To get a sense of what a single session might look like, the following image shows a plot of a single user session as it relates to one of the features — “track loudness”, a Spotify descriptor of the song's characteristics, not “volume” in the traditional sense — where the color indicates which tracks were skipped and not skipped.
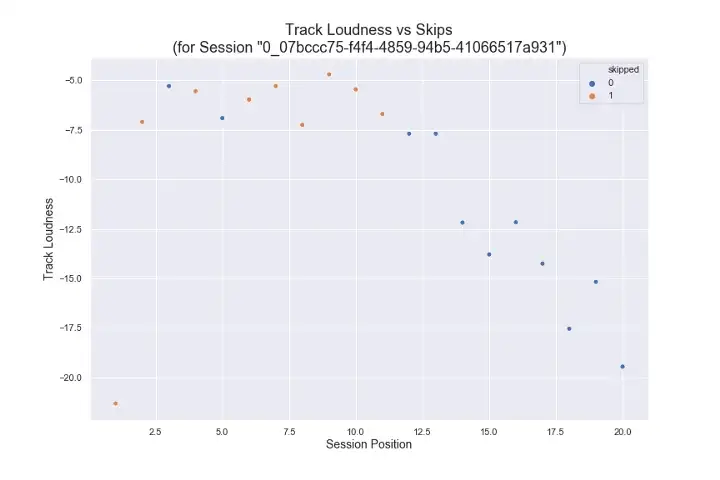 Single Session's Track-Skips vs Track-Loudness
While not meaningful by itself, this illustrates how each session an be plotted against the song attributes. In this example, the user only listened to two of the first 11 tracks, and then listened to all of the remaining 9 tracks, as the loudness value decreased.
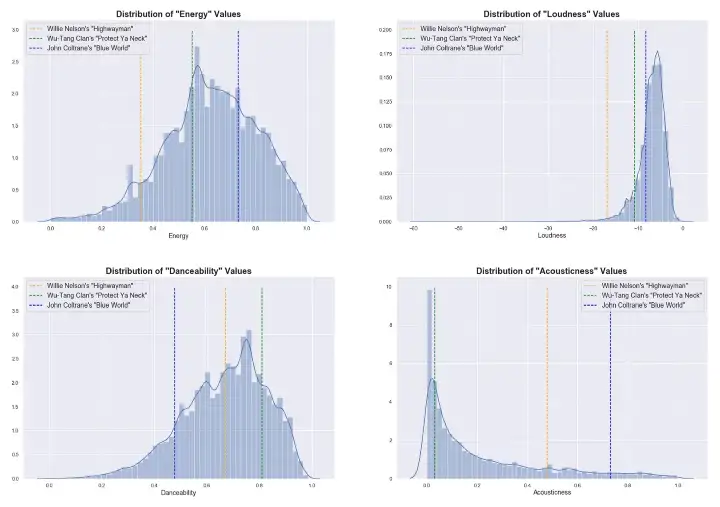
Further, in order to get a better sense of the overall distribution track attributes, I've plotted the distribution of a small subset of the features and highlighted where three different songs fall in the distribution (using data from the Spotify API). The three songs, from three different genres, are:
- Willie Nelson's "Highwayman" (Country)
- Wu-Tang Clan's “Protect Ya Neck” (Hip-Hop/R&B)
- John Coltrane's “Blue World” (Jazz)
Below are the attribute distribution plots for the attributes “energy”, “loudness”, “danceability”, and “acousticness”:
 Distribution of a Subset of Track Features with 3 Songs Plotted for Reference
Feature Engineering
This data is inherently sequential. The model's skip-prediction for any given song will be based on the songs that were skipped earlier in the user listening session. Therefore, in order for my model to account for that, I added a group of features that represent the previous tracks' audio features as well as whether or not those tracks were skipped.
Side-Note: I also tried an alternative approach where I added two sets of features corresponding to the average track feature information for previous tracks that were skipped and tracks that were not skipped, respectively, but found that it took longer to compute, added twice the number of features, and didn't improve model performance.
Model Selection
The target metric is accuracy, per competition guidelines.
I started by baselining with a Logistic Regression model but found that it had poor accuracy. So from there, I moved on to tree-based models which would be less interpretable but would be able to automatically handle complex feature interactions.
Results
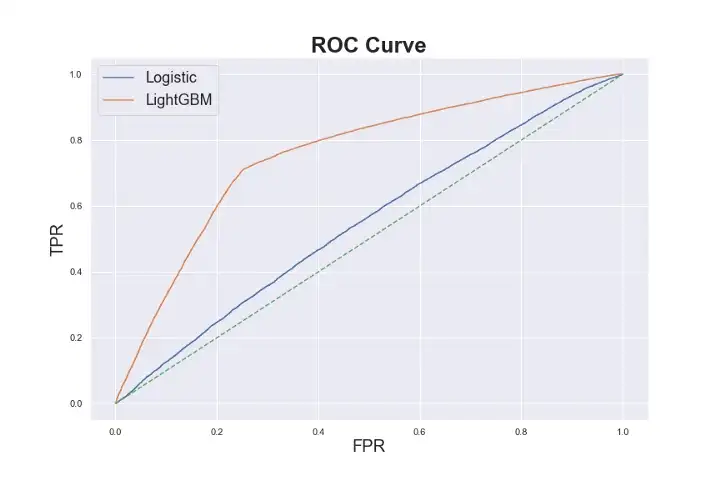 ROC Curve Comparing Model Performance for Logistic Regression and LightGBM Models
My best model's final test accuracy was 0.73, using LightGBM's LGBMClassifier model, which is fairly good given the problem but with room for improvement.
After training the model, I analyzed the errors, looking for areas to improve the model, but didn't find any clear trends in the residuals.
Conclusions
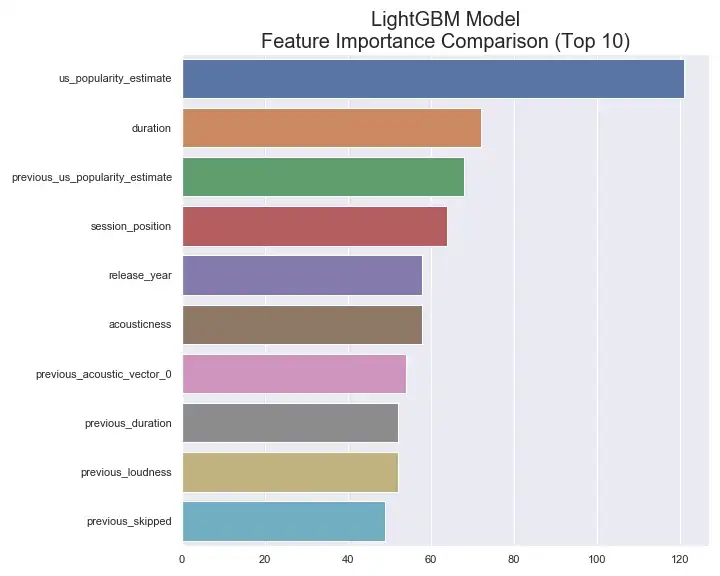 Final LightGBM Model's Relative Feature Importance Ranking
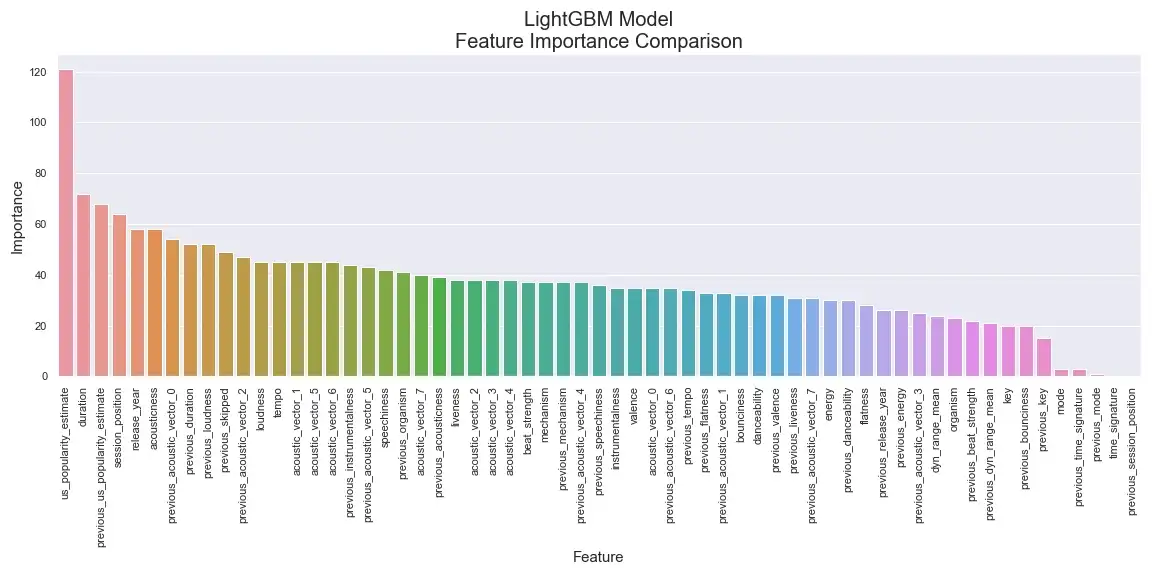
This figure shows the final model's ranking of the top 10 features by relative importance. The model ranked track popularity as the most important feature, followed by the track duration, and then the previous track's popularity. The ranking seems to generally make sense and isn't picking up on anything too surprising, other than possibly the fact that track popularity is ranked much higher than the next most important feature. Interestingly, though, this graph (as well as the graph of the full ranking which can be seen below, in the appendix) shows that, in a few cases, the model seems to be comparing features for the current track and the previous track. Some examples include popularity, duration, and loudness.
Again, the model performance is reasonable, with an accuracy of 0.73 compared to a completely naive model (always predicting that the track will be skipped) that would have an accuracy of 0.51, but still with plenty of room for improvement.
Future Work
Moving forward, a few areas for continued work include:
- Add unsupervised learning to cluster songs based on track features and possibly generate “pseudo-genres”
- Make predictions using a Recurrent Neural Network, that could more naturally handle sequential track information
- Supplement the dataset with more data from Spotify's API (e.x. genre information)
- Create a Flask app that uses D3 to visualize model predictions and allow the user to interactively explore the dataset
Thanks for reading and I'd love to hear your thoughts!
Appendix
- Acousticness: Likelihood a track is acoustic
- Danceability: Describes how suitable a track is for dancing
- Energy: Measure of a track's intensity
- Valence: Level of “positiveness” conveyed by a track
- Speachiness: Detects the presence of spoken words
Feature Subset Description
- Acousticness: Likelihood a track is acoustic
- Danceability: Describes how suitable a track is for dancing
- Energy: Measure of a track’s intensity
- Valence: Level of “positiveness” conveyed by a track
- Speachiness: Detects the presence of spoken words
Full Model Feature Importance Rank
Track “Acoustic Vector” Correlation Matrix
Citations
Here's a link to the challenge site (which has more information on the dataset and the challenge rules).
[1] B. Brost, R. Mehrotra, and T. Jehan, The Music Streaming Sessions Dataset (2019), Proceedings of the 2019 Web Conference